Background
The new year started off with a very interesting ticket logged on our support desk. The premise of the issue was a routine that would normally finish in seconds, or at most minutes, not appearing to start let alone finish. The user had tried crashing out of GP and even asking everyone else to log off however the problem persisted.
The Issue
The issue was occurring when running an “Extract” routine in the third party module Nolans Advanced Bank Reconciliation. This routine extracts all the data from the GL into third party tables based on parameters specified by the user.
The window used to initiate the process is below.
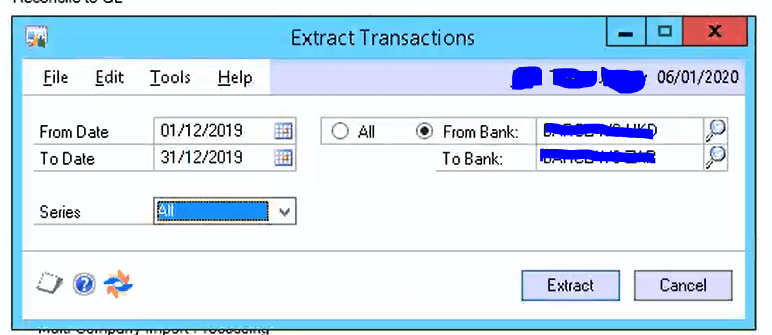
** Please note the window accepts a couple of parameters
After entering the above parameters and clicking “Extract” the process “hung” on 0% as per below:
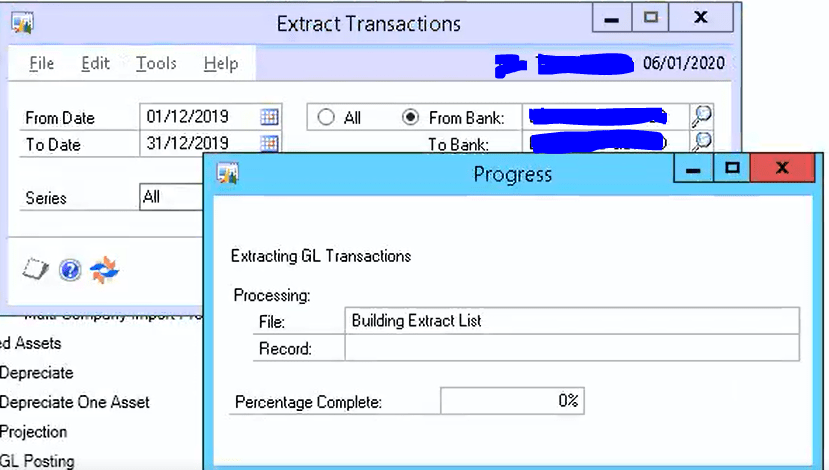
The client left this for over an hour and the progress didn’t move. It remained on 0% the whole time. At this point they crashed out of Dynamics GP manually.
The Troubleshooting Process
The first thing I did to troubleshoot this issue was setup an SQL trace so I could log the SQL calls after clicking “Extract”. I then set off the process again and checked the trace. This highlighted the stored procedure that was running the extract routine is ncExtractGLTransactions as per below.

I left this running for a few minutes and nothing happened. Next, I wanted to confirm nothing was blocking the SQL process. To do this I used Adam Machanic’s awesome free SQL monitoring tool “sp_whoisactive” (http://whoisactive.com). After running this I could see nothing was blocking the process.
Therefore the conclusion at this point is the process is running (via the ncExtractGLTransactions stored procedure) but for some reason its taking a very long time to complete.
As this routine normally runs daily without issue my SQL senses had me thinking this could be a case of “bad” parameter sniffing.
Parameter sniffing and execution plan reuse
At this point I’ll try and give a very short overview of parameter sniffing and execution plan creation.
When a stored procedure runs the SQL query optimiser first checks if an execution plan already exists in the plan cache for the stored procedure, and if one doesn’t exist an execution plan is created and cached using the inputs provided (i.e. the parameter inputs are “sniffed” and used to create the execution plan) . This execution plan is then used to execute the query. If the stored procedure is executed again SQL will reuse that execution plan and therefore save time creating and compiling a new one. (this is why generally parameter sniffing is regarded as a good thing)
However issues can arise if the execution plan is reused based on parameters that would give completely different results. For example if the stored procedure is first executed with parameters that would only give a very small result set an execution plan might be created using index seeks and lookups. However if its then ran using parameters that would produce a very large result set index seeks and lookups might not be optimal way to do this. In this case it might be much quicker to perform table\index scans.
The Immediate Fix
To see if parameter sniffing was causing the issue I decided to find the execution plan for the stored procedure and evict it from the plan cache thus forcing SQL to create a new plan based on the inputs the client was using the next time the stored procedure was executed.
Please note there are other ways to do this such as marking the stored procedure for recompilation using the system stored procedure “sp_recompile” however I chose the plan cache route. This is mainly because I get to have more of a nosy around 🙂 i.e. running this query you can see when the execution plan was created and a gather whole host of other information.
To find the execution plan I used the script below:
SELECT plan1.query_plan,qs.plan_handle, a.attrlist, qs.*,est.*
FROM   sys.dm_exec_query_stats qs
CROSS  APPLY sys.dm_exec_sql_text(qs.sql_handle) est
CROSS APPLY sys.dm_exec_query_plan(qs.plan_handle) plan1
CROSS  APPLY (SELECT epa.attribute + '=' + convert(nvarchar(127), epa.value) + '   '
              FROM   sys.dm_exec_plan_attributes(qs.plan_handle) epa
              WHERE  epa.is_cache_key = 1
              ORDER  BY epa.attribute
              FOR    XML PATH('')) AS a(attrlist)
WHERE  est.objectid = object_id ('dbo.ncExtractGLTransactions')
  AND  est.dbid     = db_id('DBName')
** Please note I acquired this script from someone else either via a blog or book however as it was such a long time ago I can’t recall who exactly to credit them.
I then took the plan handle and ran the query below to evict the execution plan:
DBCC FREEPROCCACHE (<plan handle>)After this had been done I ran the process again and it completed as normal! (I also ran the first query again and I can see based on the plan creation date it was a brand new execution plan)
The Long Term Fix
Going forwards I could “fix” this by adding the “WITH RECOMPILE” option to the stored procedure so that an execution plan is created but never stored when its executed. Therefore every time the stored procedure is ran a brand new optimal execution plan will be created. The only downside is a CPU hit while the execution plan is created.
Alternatively I could add the OPTION (RECOMPILE) hint to the statement within the stored procedure that is causing the issue so a plan is still created and cached however it won’t be for the troublesome statement.
Final thoughts
Some other things to bear in mind is that execution plans don’t stay in the plan cache forever, which is why you won’t necessarily come across this issue very often.
For example index maintenance and updating statistics, which are routines you might run frequently on your SQL server databases, will invalidate associated executions plans causing them to recompile the next time the stored procedure is ran. Therefore its possible that if I’d have left this issue overnight and index maintenance would have ran, this would have invalidated the plan, and the next time the user ran the routine a new execution plan would have been created and the routine would have ran as normal. This gives the impression the issue has “fixed itself” when in fact a new execution plan was created and used which resolved the issue.
I hope this helps anyone else who comes across routines that suddenly run slowly when they had previously ran fine. It might also answer why when you leave issues overnight things can appear to have magically fix themselves when you try again the next day 🙂
Thanks for reading!
Thinking of making the move to Business Central? We can help
