Dynamics 365 Business Central – Shortcut Dimensions and Why Your Dimensions Aren’t Visible on Journal and Document Lines

Introduction

It’s common for users to overlook a crucial step when setting up new Dimensions in Business Central, which can result in the Dimensions not being easily visible or accessible in various documents and journals pages.

This post will guide you through the process of adding a new Dimension and explain the final, often overlooked step that makes your Dimensions easily accessible.

As a side note, I think it also explains why these dimensions are referred to as “Shortcut” dimensions πŸ˜‰

Create a new Dimension

One of the things I love most about Business Central is how simple it is to gain additional financial insights by adding additional Dimensions, without the need to create new General Ledger accounts. (this harks back to my Dynamics GP days 😊)

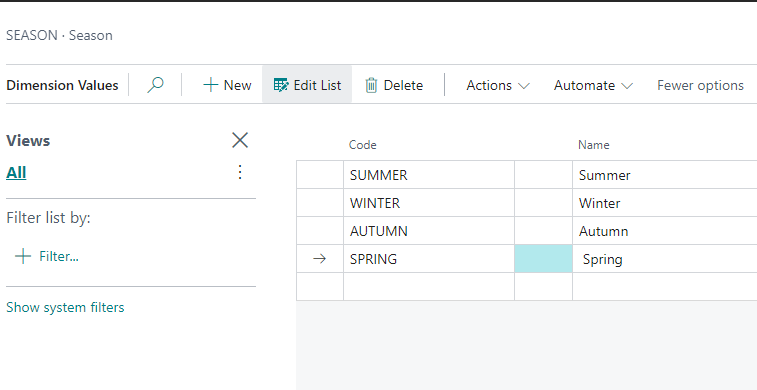
In this instance I want to start analysing my financial data by SEASON, so I’ll go to “Dimensions” and create the new Dimension and Dimension Values. (note how I already have lots of other dimensions i.e. AREA and BUSINESSGROUP etc)

I’ll now add the Dimension Values I want to analyse to:

Lets use it in a General Journal

Now I’ve created the new Dimension, I’ll use it in a General Journal, however on first inspection its not available as a column for me to use?

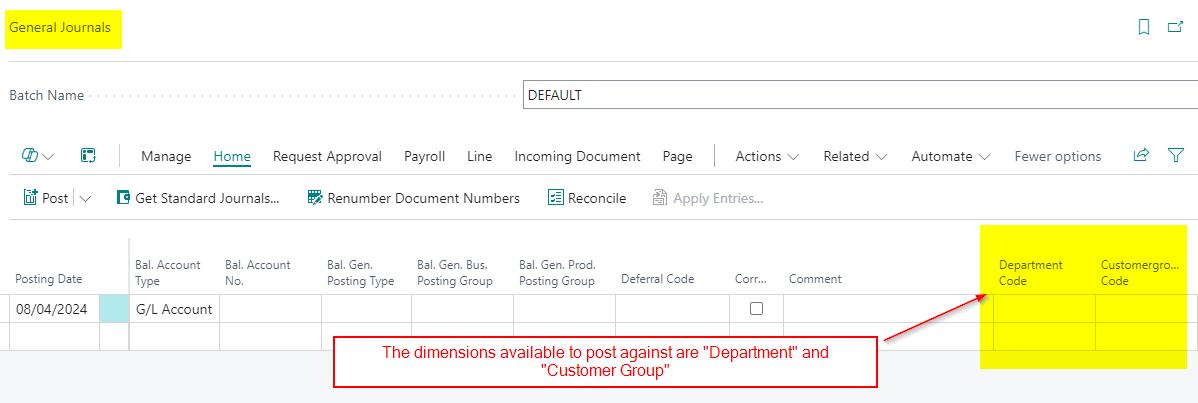
In fact, as you can see from my screen shot above, the only dimensions I have available are “DEPARTMENT” and “CUSTOMERGROUP”? Why can’t I post to my other dimensions like my new SEASON dimension and the other existing dimensions like AREA and BUSINESSGROUP etc?

The simple answer is that I can – it’s just not immediately obvious. By clicking “Line > Dimensions”, as shown below, I can access all my dimensions.

This is great, but I want to be able to enter them easily, right on the journal line, just like I can with “DEPARTMENT” and “CUSTOMERGROUP”.

Essentially, I want these dimensions to be more accessible – to be “shortcuts”, if you will. (Hold that thought πŸ˜‰)

Let’s make them “shortcuts”

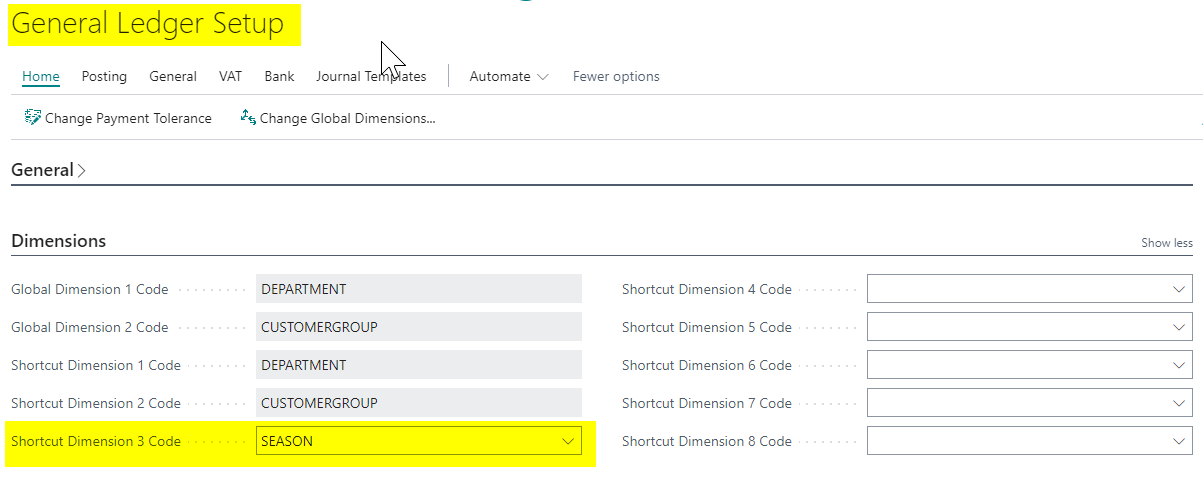
The solution to this issue is found on the “General Ledger Setup” page.

After creating a new Dimension, the final step is to add it as a “Shortcut” dimension on the “General Ledger Setup” page.

In my company, I’ve only added DEPARTMENT and CUSTOMERGROUP as shortcut dimensions, which is why those are the only ones I can see on the journal lines:

When you designate a dimension as a “Shortcut” dimension in the General Ledger Setup, it becomes available on the lines of Journals and Documents.

I’ll therefore add my new Dimension, SEASON, as my “Shortcut Dimension 3 Code”

Now, when I open my General Journal page, I can see the SEASON dimension alongside the DEPARTMENT and CUSTOMERGROUP dimensions.

I no longer have to click “Line > Dimensions”, its available as a “shortcut” right on the journal line 😊

Conclusion

This post highlights the importance of completing the final configuration step when creating Dimensions: adding them to your General Ledger Setup. Without this step, using the dimensions in Journals and Documents requires more clicks and is therefore more difficult.

It’s also clear now that, although you can create an unlimited number of dimensions, you can only have a maximum of eight shortcut dimensions. Any additional dimensions will need to be accessed through the menu bar options.

Thanks for reading!

Dynamics 365 Business Central – How to quickly split the balance of a General Ledger account across Dimensions using a Recurring General Journal

Introduction

At the end of a period it maybe necessary to split the balance of an General Ledger account across dimensions. This might be useful if you accumulate costs in a General Ledger account and only split those across cost centres at the period end.

In this post I’ll go through how this can be achieved quickly and easily using the Recurring Journal.

Recurring Journal

The recurring journal in Business Central provides the means of handling repetitive journals that occur on a regular basis.

One example might be a monthly depreciation journal or recurring revenue and expenses. (although I’d hope anyone would be using the Fixed Assets module for monthly depreciation 😊). Typically you’d be using the same or very similar amounts so would use a “Recurring Method” of “Fixed” or “Variable” for those journals.

However there is a “Recurring Method” of “Balance” that provides the ability to transfer the balance of an General Ledger account to another General Ledger account, or more interestingly, split the balance of an account across dimension values.

For example, let’s say I’ve been accumulating “Office Supplies” expenses under one General Ledger code and at the end of the month I want to split this by departmental cost centres.

This see how this works with a Recurring General Journal.

Worked Example

Through the month I’ve accumulated Β£1000 worth of costs in the “Office Supplies” account.

If I look at a “G/L Balance by Dimension” you can see I have no Dimensional analysis.

At month end I now want to split these costs across my departments. To do this I open the “Recurring General Journal” page, select the “Balance” recurring method, and pickup the “Office Supplies” account. (Note I don’t enter any amount in the journal)

Next we’ll allocate the balance across the “Department” dimension. I want to allocate 20% to the Sales department, 50% to Production and 30% to Admin.

To do this click “Allocations” in the ribbon and pickup the Office Supplies General Ledger account and enter 20% percentage and click “Dimensions”

I then select “Department” as the Dimension Code and “SALES” as the Dimension Value.

I repeat this for Dimension Values “ADM” and “PRODUCTION”, each time entering the Office Supplies General Ledger account, then clicking “Dimension” in the ribbon, and picking up the relevant dimension value.

I now have the allocations I require as per below.

Now when I preview post the journal I can see how this will now be split over the various departments

Finally when I view the “G/L Balance by Dimension” I can see the split across my Department dimension

Conclusion

Although I could have used a normal “General Journal” for this entry, this method shows how you can utilise the “Recurring General Journal” to split costs across dimensions, without needing to know the actual balance of the account therefore reducing errors and saving time.

Thanks for reading!

Dynamics 365 Business Central – A closer look at the Net Change, Balance at Date and Balance FlowFields on the Chart of Accounts page

Introduction

The chart of accounts page is one of the most frequently used pages in Business Central. It can provide a wealth of information, offering unique insights into the balances on GL accounts, at the click of a button.

When showing new users the Chart of Accounts page in Business Central, I always go through how the Net Change, Balance at Date and Balance columns work and what information they provide.

In this post, I will delve into the details of each column, highlighting their significance and how they work.

Add the Balance at Date Column

By default the Chart of Accounts page only displays the “Net Change” and “Balance” columns. Therefore the first thing to do is to personalise the page and add the “Balance at Date”.

You can do this in the usual way as per below:

FlowFields and FlowFilters

Providing some context, the “Net Change,” “Balance at Date,” and “Balance” columns featured on the Chart of Accounts page are referred to as FlowFields. This means they are calculated fields, and the values they display are influenced by any FlowFilters that are added to the page. In this case the FlowFilter is any filter added to the “Filter totals by” option on the filter pane as shown below

Here I’ve added a date filter which will directly affect the values displayed in the “Net Change”, “Balance at Date” and “Balance” columns.

Lets see them in action

To describe how each column works I’ve posted the following transactions in January, February and March, each for Β£100.00

Without any filter, all columns will show Β£300.00, however I’ll then add a filter for February in the “Filter totals by” as per below

As you can see each column now has a different value, so let’s go through what each is showing:

Net Change:- This is only totalling the transactions posted within the filter. In this case we have a filter of 01/02/24..29/02/24 and we have one transaction for Β£100.00 posted in this range, therefore the value shown is Β£100.00. If I drill down on this value the system opens the “General Ledger Entries” page with this filter applied showing the entry:

Balance at Date:- This is totalling the balance at the end of the filter. In this case the end of the filter is 29/02/24 and I have two transactions that match this criteria, one in January and one in February, both for Β£100.00. Therefore the balance shows Β£200.00. Again, if I drill down on this value the system opens the “General Ledger Entries” page with this filter automatically applied showing the entries that make up the balance:

Balance:- This disregards the filter and shows the total of the account regardless of the filter. In this case the balance shows Β£300.00, as I have three entries totalling Β£300.00. Once again, if I drill down on this value the system opens the “General Ledger Entries” page, but this time with no date filter applied:

Hopefully this demonstrates how each of the columns work and how when you drill down on the values the system automatically applies filters to the “General Ledger Entries” page showing the detail of the calculation.

How about filtering by Dimension

In this example you can see how the values are being influenced by a FlowFilter entered using the posting date, giving useful insights into the balances of your GL accounts over different periods of time.

However, what might be even more interesting is rather than using date, you could use your Global Dimensions, which are also available as FlowFilters. (this is why its important to choose the correct Global Dimensions when configuring Business Central, as I explain in this video series)

In my demo system I have “Department” and “Customergroup” as Global Dimensions so I could apply a FlowFilter on one of my Departments to filter the values for just one department. For example below I add a filter on the Department SALES to filter values that have been posted to the SALES dimension.

Here, at the click of a button, I can real time insights into values posted to the SALES dimension.

Conclusion

The chart of accounts page perfectly showcases the FlowFilters and Flowfields highlighting how you can get insights into data very quickly and easily.

These filters are available throughout Business Central on pages like Customers and Vendors, granting users immediate access to essential data without the need for complex reports.

Thanks for reading!