Introduction
The chart of accounts page is one of the most frequently used pages in Business Central. It can provide a wealth of information, offering unique insights into the balances on GL accounts, at the click of a button.
When showing new users the Chart of Accounts page in Business Central, I always go through how the Net Change, Balance at Date and Balance columns work and what information they provide.
In this post, I will delve into the details of each column, highlighting their significance and how they work.
Add the Balance at Date Column
By default the Chart of Accounts page only displays the “Net Change” and “Balance” columns. Therefore the first thing to do is to personalise the page and add the “Balance at Date”.
You can do this in the usual way as per below:

FlowFields and FlowFilters
Providing some context, the “Net Change,” “Balance at Date,” and “Balance” columns featured on the Chart of Accounts page are referred to as FlowFields. This means they are calculated fields, and the values they display are influenced by any FlowFilters that are added to the page. In this case the FlowFilter is any filter added to the “Filter totals by” option on the filter pane as shown below
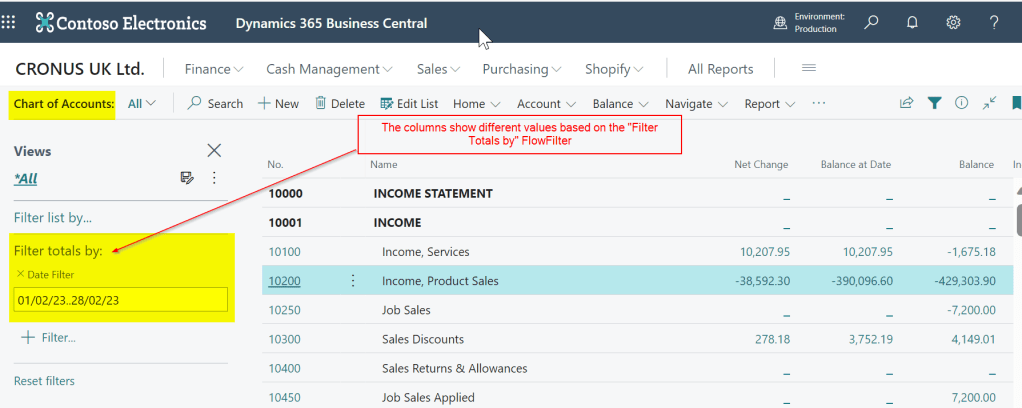
Here I’ve added a date filter which will directly affect the values displayed in the “Net Change”, “Balance at Date” and “Balance” columns.
Lets see them in action
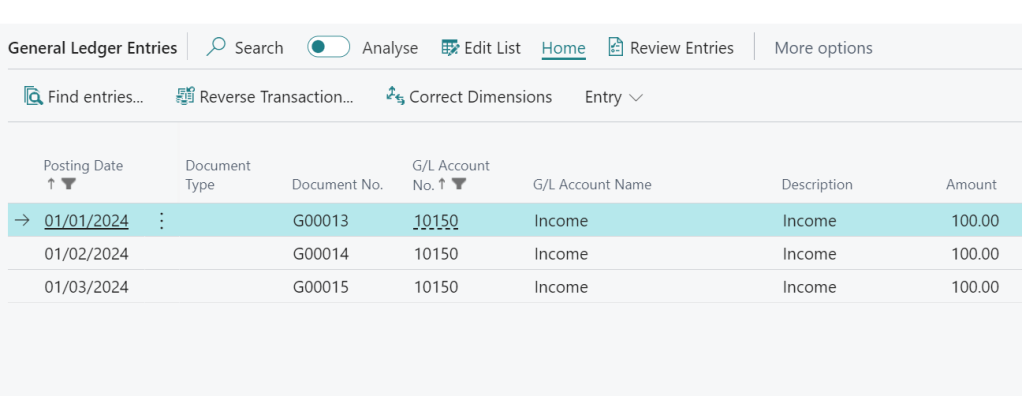
To describe how each column works I’ve posted the following transactions in January, February and March, each for £100.00
Without any filter, all columns will show £300.00, however I’ll then add a filter for February in the “Filter totals by” as per below
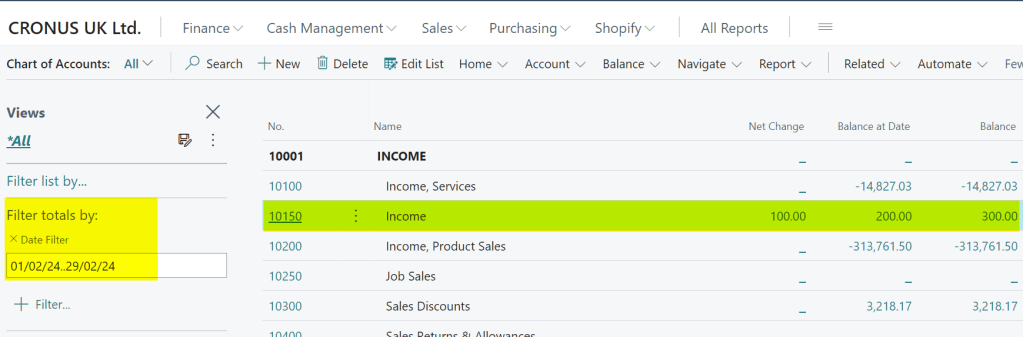
As you can see each column now has a different value, so let’s go through what each is showing:
Net Change:- This is only totalling the transactions posted within the filter. In this case we have a filter of 01/02/24..29/02/24 and we have one transaction for £100.00 posted in this range, therefore the value shown is £100.00. If I drill down on this value the system opens the “General Ledger Entries” page with this filter applied showing the entry:
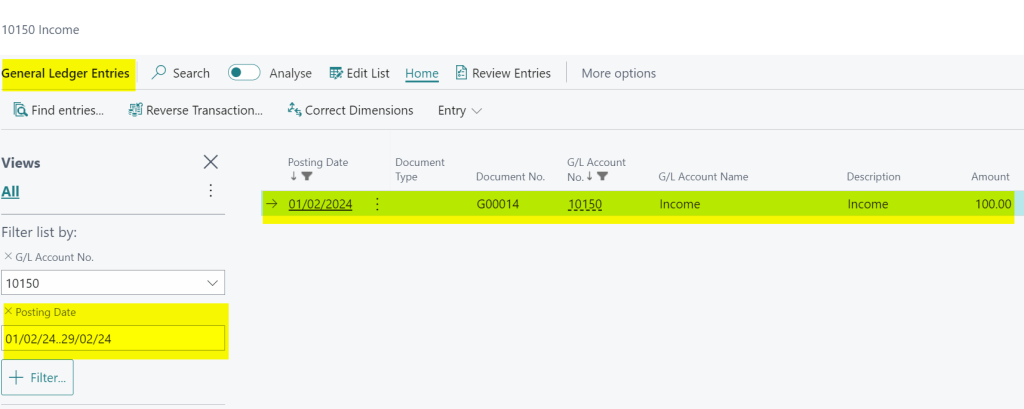
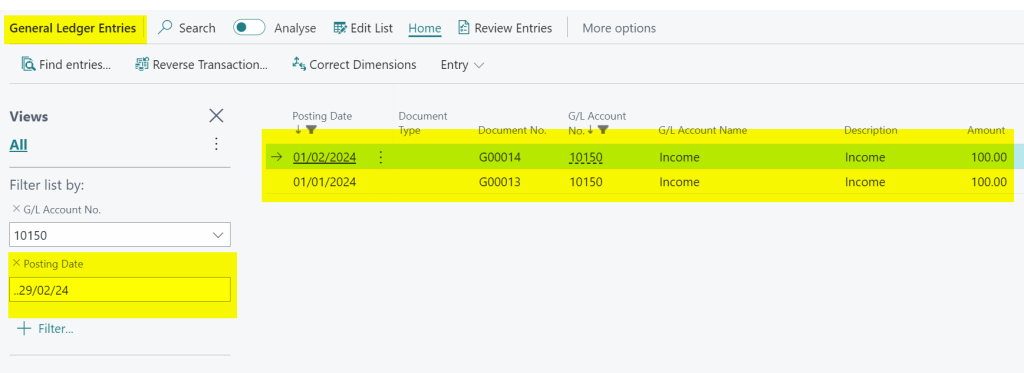
Balance at Date:- This is totalling the balance at the end of the filter. In this case the end of the filter is 29/02/24 and I have two transactions that match this criteria, one in January and one in February, both for £100.00. Therefore the balance shows £200.00. Again, if I drill down on this value the system opens the “General Ledger Entries” page with this filter automatically applied showing the entries that make up the balance:
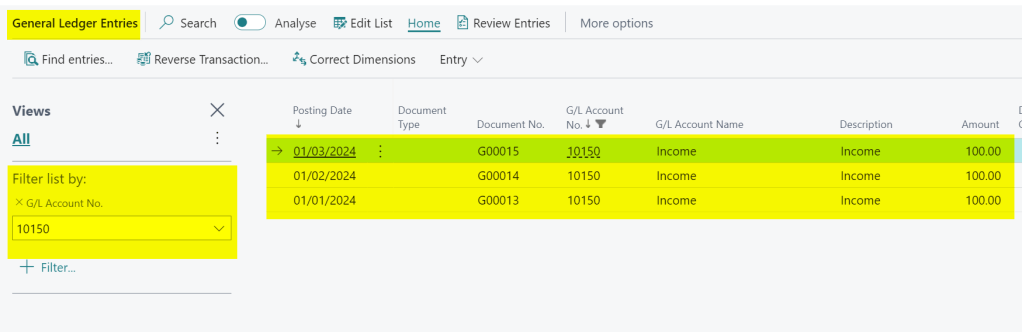
Balance:- This disregards the filter and shows the total of the account regardless of the filter. In this case the balance shows £300.00, as I have three entries totalling £300.00. Once again, if I drill down on this value the system opens the “General Ledger Entries” page, but this time with no date filter applied:
Hopefully this demonstrates how each of the columns work and how when you drill down on the values the system automatically applies filters to the “General Ledger Entries” page showing the detail of the calculation.
How about filtering by Dimension
In this example you can see how the values are being influenced by a FlowFilter entered using the posting date, giving useful insights into the balances of your GL accounts over different periods of time.
However, what might be even more interesting is rather than using date, you could use your Global Dimensions, which are also available as FlowFilters. (this is why its important to choose the correct Global Dimensions when configuring Business Central, as I explain in this video series)
In my demo system I have “Department” and “Customergroup” as Global Dimensions so I could apply a FlowFilter on one of my Departments to filter the values for just one department. For example below I add a filter on the Department SALES to filter values that have been posted to the SALES dimension.

Here, at the click of a button, I can real time insights into values posted to the SALES dimension.
Conclusion
The chart of accounts page perfectly showcases the FlowFilters and Flowfields highlighting how you can get insights into data very quickly and easily.
These filters are available throughout Business Central on pages like Customers and Vendors, granting users immediate access to essential data without the need for complex reports.
Thanks for reading!
